Place and Technology: Mobile phone, computer and ipad
INTRODUCTION:
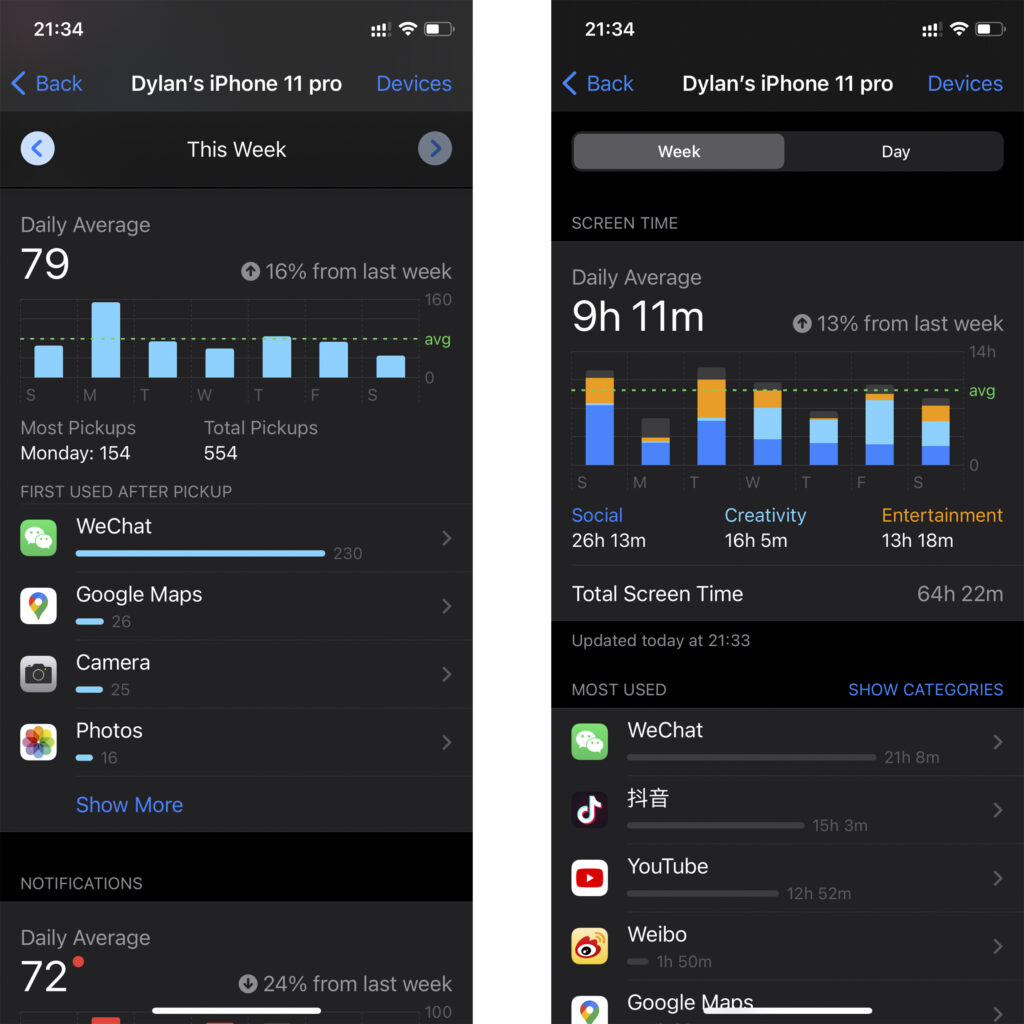
I am a person who can’t do without a mobile phone, and I spend a long time using it every day. Although this is not good, it is one of the few interests. I want to record how often I use my mobile phone.
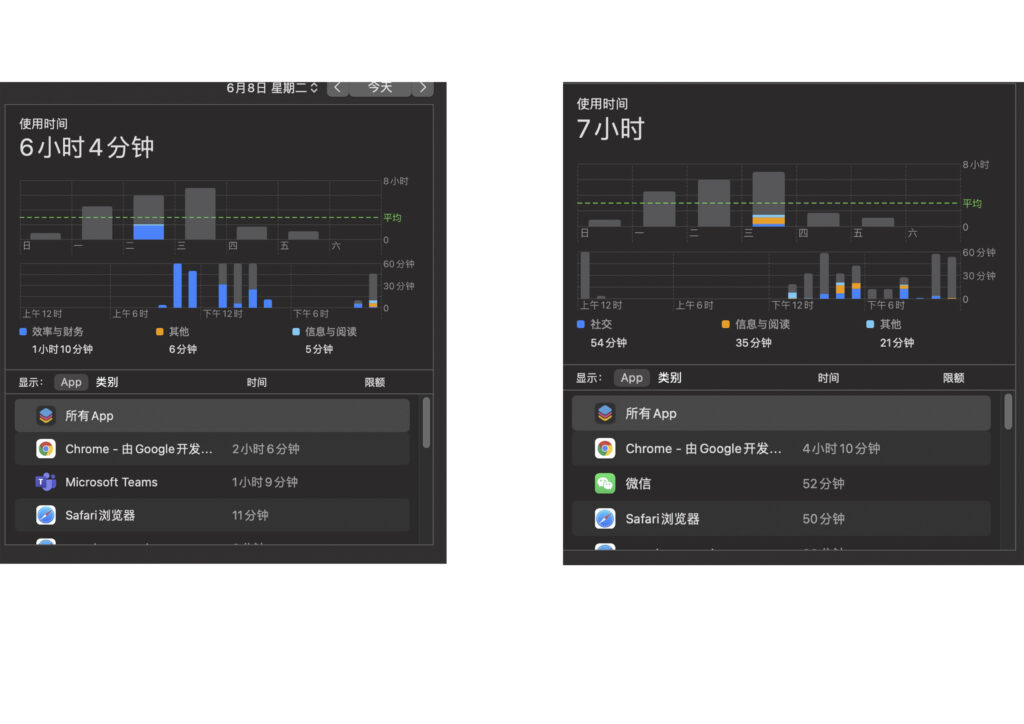
Computer usage:
Reference:
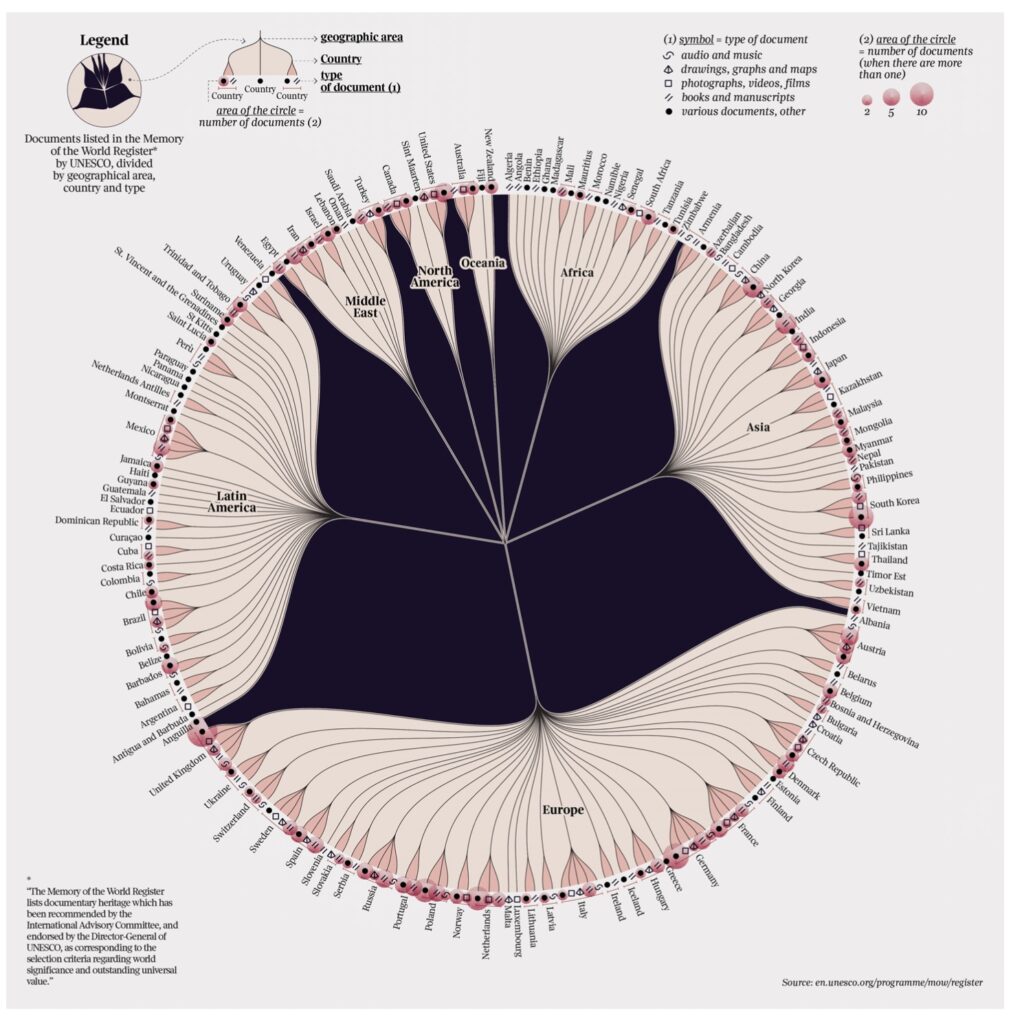
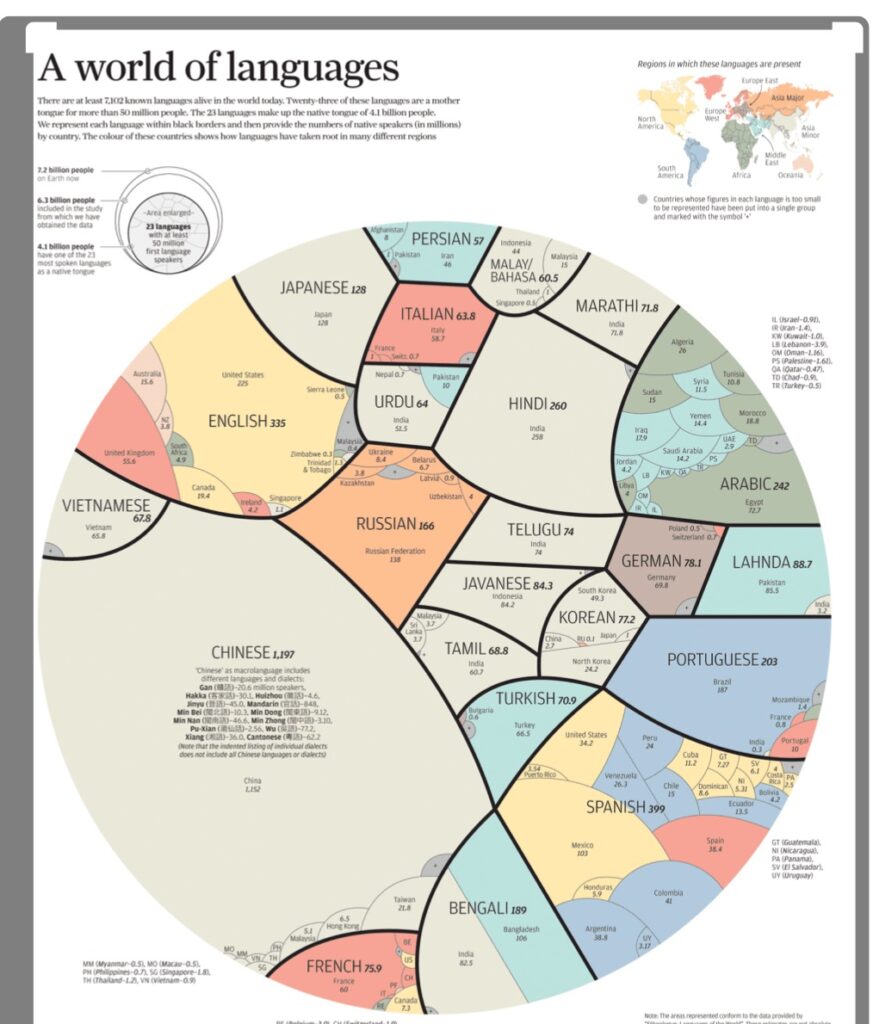
I have selected three data visualization references on the design website. I think these designs are very interesting and have helped my design.
This picture has a lot of data, using different colors and graphics to introduce the distribution of various languages in the world, and the dialects of each language.

Analysis:
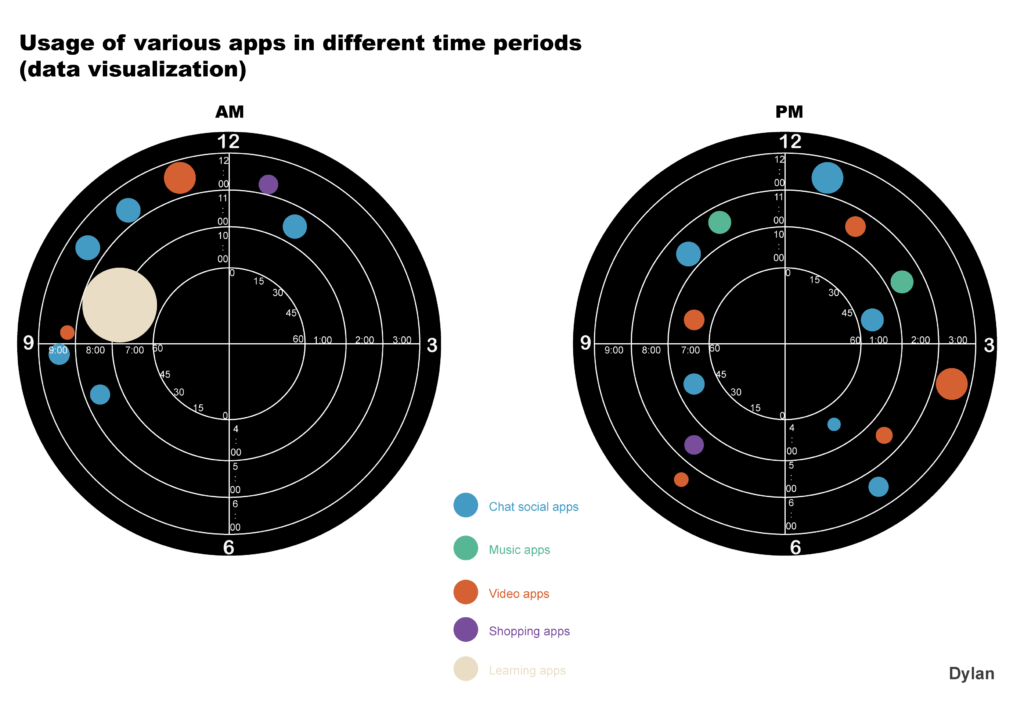
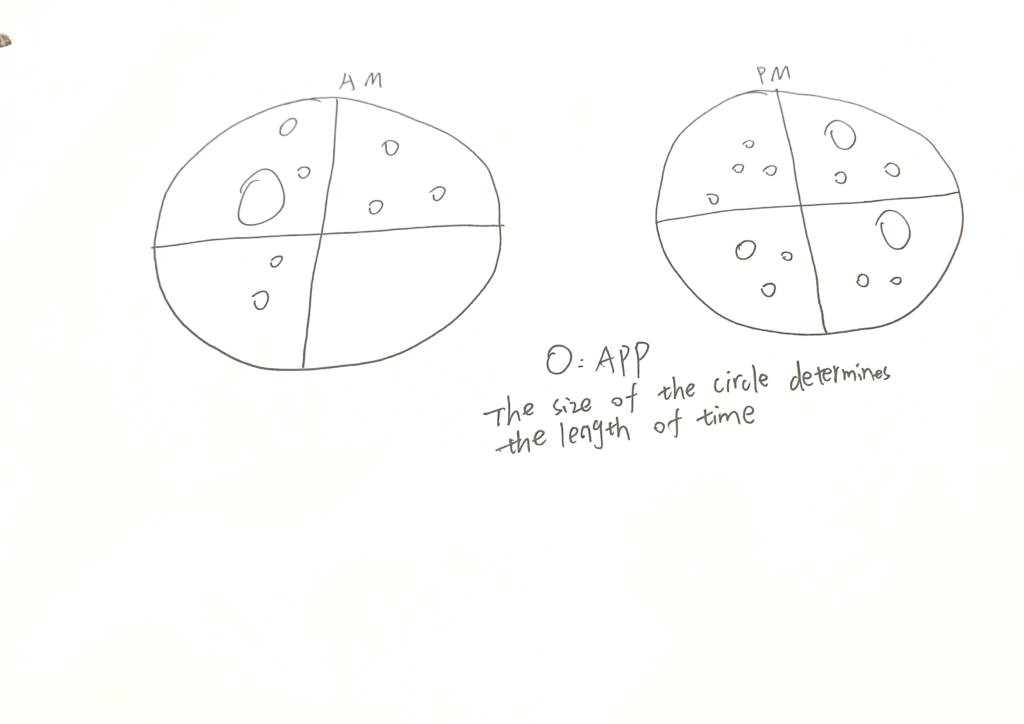
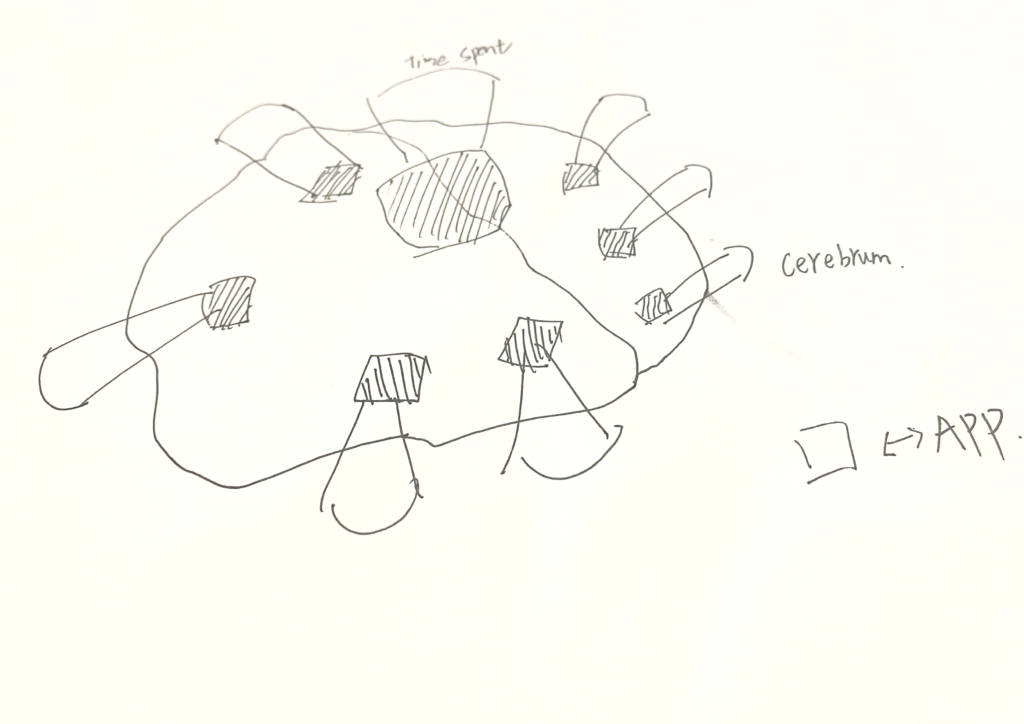
According to the usage time of the mobile phone screen and the usage time of each APP, I will make a data visualization statistical graph. After communicating with Andy, I can refer to the function of the phone screen usage time and add some interesting elements in it.
Sketch:
DATA VISUALIZATION OUTCOME 1

DATA VISUALIZATION OUTCOME 2: